OpenTelemetry has been gaining some noticeable popularity over the last few years, and there are a handful of articles that discuss its advantages and use cases, as well as demonstrating some single-class usage examples. There are also some tutorials that discuss tracing inside a web-application, which components, again, are mostly running on the same server. However, when it comes to building out a system for message tracing inside a distributed application, consisting of several components that communicate via API and/or Message Queues (MQ), there is a very limited set of examples available, if any.
As I recently had to solve a similar problem at work, I figured it might be helpful to build out a generic POC that I could share with the community for reference and insights.
This article covers the imaginary scenario that will be used to demonstrate problems that an owner of a disturbed system may face,, and the way we can solve them using OpenTelemetry.
I decided to use Kafka queue for messaging between the services, and, for visualization, I am using Jaeger, but using any other MQ and/or trace collection system of your choice should not require significant changes to the code.
I am also sharing the source code of this POC (fully dockerized), should you want to examine the implementation details closer and/or use it as a base for your future development. The branches of interest are “no-tracing” and “opentelemetry-tracing”. I hope their names are descriptive enough to tell you which one contains the added opentelemetry code 😉
Please note, neither this article nor the accompanying code are examples of building a SECURE system! The code has been written in the most simple way to demonstrate the usage of opentelemetry tracing. Make sure you take all the steps necessary when designing and implementing YOUR system to ensure it follows industry application security best practices and your organization's guidelines.
Please note, this article does not contain any guidance on how to configure Kafka queue and Jaeger. In my dockerized test environment, they are deployed using their corresponding docker images and basic configurations, and there are plenty of resources online that discuss more granular configs and deployment types.
Scenario
For this project, let’s imagine that we operate a sushi restaurant – ITuna (as in “IT”, and not as in “iPhone”, although, read it as you like), which is proud to have their cooking process tracked via an IT system.
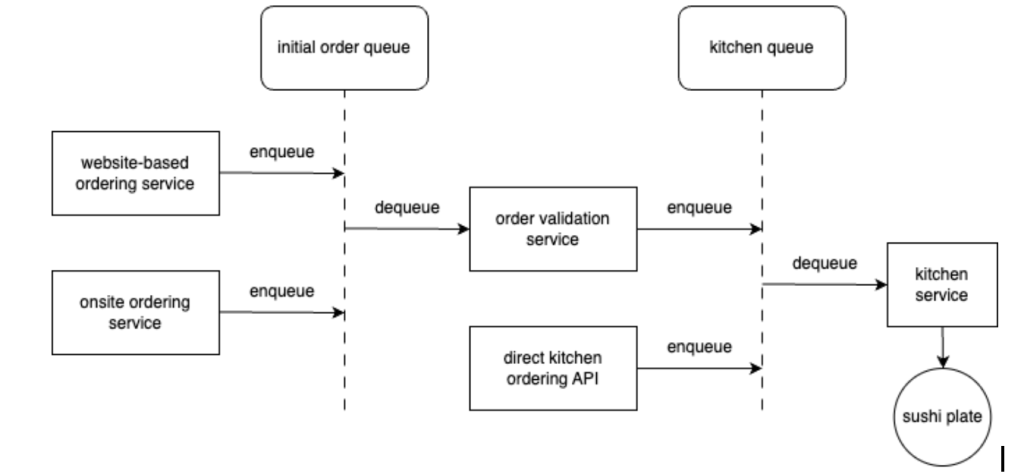
ITuna service, still being in initial phase of its development, has the following components running as individual processes, which communicate with each other using a queue system (Kafka):
- Website-based ordering service;
- Onsite ordering service;
- Order validation service, which checks that an order can be fulfilled based on inventory, chef availability etc.;
- Direct kitchen ordering service – made at the management request, bypasses order validation part;
- Cooking service, which is actually responsible for cutting all the fish and placing it beautifully on a plate with some ginger and wasabi.
The overall design can be visualized as follows:

While not depicted on the diagram, some components consist of multiple tasks that operate in order. For example, our order validation service has three tasks it actually performs – validating the address, the name and the inventory.
As with any complex systems, there are parts that execute almost immediately and almost never fail, but there are also those that may take a long time to do their processing due to lack of optimization or simply bugs, causing the overall pipeline to perform worse than it could potentially do.
After some time in operation, we start asking ourselves whether there is any way to optimize the processing. Also, some customers complain that it takes way too long for their orders to be prepared. Is there a way to find a possible bottleneck?
Using logging for performance insights
Of course, no application is complete without some sort of logging configured, and ITuna is no exception. In our application, we log events such as the start-up of each of the 5 component services, as well as queueing and dequeuing jobs. The logs contain timestamps, which, one can say, could be used to calculate processing times by doing dime diffs, but does not really give a good picture we are looking for?
Is having the logs not enough?
Reviewing the logs, we find thousands of lines in the log file like those below:
2024-11-20 21:38:54 - website-ordering - INFO - Placing an online order with id c18652e2-982a-4b40-be21-ee1cd619a920
2024-11-20 21:38:54 - website-ordering - INFO - Placing an online order with id c18652e2-982a-4b40-be21-ee1cd619a920
2024-11-20 21:38:56 - website-ordering - INFO - The online order has been placed successfully!
2024-11-20 21:38:56 - onsite-ordering - INFO - The on-site order has been placed successfully!
2024-11-20 21:38:58 - direct-kitchen-ordering - INFO - Placing a direct order for the kitchen: 7964b459-cacf-4b60-afff-da49b41c6f8c
2024-11-20 21:39:01 - website-ordering - INFO - Placing an online order with id 3e3b41eb-eb82-40e9-b9e2-b165bced0558
2024-11-20 21:39:01 - onsite-ordering - INFO - Placing an on-site order with id bb24963a-d752-4d0b-825a-e3e7c2d2d464
2024-11-20 21:39:02 - kitchen-service - INFO - Received order 7964b459-cacf-4b60-afff-da49b41c6f8c for processing
2024-11-20 21:39:03 - kitchen-service - INFO - Your order is ready. Please enjoy your SPICY ITUNA ROLL and other food! - Order id = 7964b459-cacf-4b60-afff-da49b41c6f8c
2024-11-20 21:39:03 - website-ordering - INFO - The online order has been placed successfully!
2024-11-20 21:39:21 - onsite-ordering - INFO - The on-site order has been placed successfully!
2024-11-20 21:39:21 - kitchen-service - INFO - Your order is ready. Please enjoy your ITUNA ROLL and other food! - Order id = a45e103d-0b6a-4404-b501-36c387a28b93
As each log entry contains the order id, we can get some picture of how long each phase took for it to be prepared, e.g. by grepping for an individual order id in the log file:
# cat ituna.log | grep 5d1e82af-e120-417e-b543-38e775992be7
2024-11-20 21:49:06 - website-ordering - INFO - Placing an online order with id 5d1e82af-e120-417e-b543-38e775992be7
2024-11-20 21:49:08 - order-validation - INFO - Received order 5d1e82af-e120-417e-b543-38e775992be7 for validation
2024-11-20 21:49:08 - order-validation - INFO - Validated and republished order for kitchen: 5d1e82af-e120-417e-b543-38e775992be7
2024-11-20 21:49:08 - kitchen-service - INFO - Received order 5d1e82af-e120-417e-b543-38e775992be7 for processing
2024-11-20 21:49:08 - kitchen-service - INFO - Your order is ready. Please enjoy your TUNA NIGIRI and other food! - Order id = 5d1e82af-e120-417e-b543-38e775992be7
While useful for a concrete case review (e.g. when an angry customer wants to know WHAT EXACTLY took it THIS LONG with HIS order ???), this does not give us a good overview of the overall performance of each service. Also, tracking the processing time of each individual subtask of a service (remember 3 tasks that order-validation does?) would require more logging added, and more diffs calculated, using all those timestamps.
While doable, this is not what we HAVE to spend time on doing, when that problem has already been solved for us.
Simple Tracing with OpenTelemetry
To enable some better analytics capabilities on the ITuna service, we will use opentelemetry framework.
We start by declaring necessary dependencies in the requirements file, installing them with pip:
opentelemetry-api
opentelemetry-sdk
opentelemetry-exporter-otlp
Next, we wrap each service/component in a span, like this:
with tracer.start_as_current_span(name="span-name") as span:
	do-work()
The job of getting the collected tracing data out for further processing is taken care of by the OpenTelemetry Protocol (OTLP) Exporter. There are a few ways to have it set up, where the most common approach is to have a data collector that aggregates data from all OTLP exporters of the system and, after some processing, forwards those to the visualization product. There is also a way to configure the exporter to serialize tracing data to a json file.
For this specific project though, the OTLP exporter was configured to send the traces directly to the Jaeger instance (see ituna-config.ini file). With a minimal setup, the tracing data is easily made available for visualization and exploration.
In cases where there are multiple code flows that are of interest to be measured individually inside the same class, child spans inside the main span can be used, reporting and modeling of which will be taken care of by opentelemetry (i.e. the parent/child span relationship will be modeled correctly).
Distributed application tracing
When, like in our case with ITuna, there are multiple systems that are involved in processing an individual job (request), tracing that request across each system and tracking spent time becomes a little more challenging.
As we want to be able to associate tracing data related to the same job even if it is gathered from multiple systems, we need to make sure the spans we start on each system share the same context as the system where the processing started (in our example, that would be either Website-, onsite- or direct-kitchen ordering service).
Luckily, it is pretty easy to do it with opentelemetry Context Propagation. All we need to do is save the context on one system, and then send it along with the primary job payload to the next component that will continue the processing. Code-wise, the required changes look like the following:
publisher side:
carrier = {}
TraceContextTextMapPropagator().inject(carrier)
consumer side (i.e. worker that needs to ‘continue’ the tracing to the same trace session):
ctx = TraceContextTextMapPropagator().extract(carrier=carrier)
with tracer.start_as_current_span(name="span-name", context=ctx) as span:
		do-work()
Here, the carrier is a dictionary containing a single string, which can be easily appended to the message that is sent through the pipeline to downstream architecture components.
Visualizing collected tracing data
After running ITuna code for a few minutes and generating some events, it is time to navigate to the Jaeger UI and review collected data!
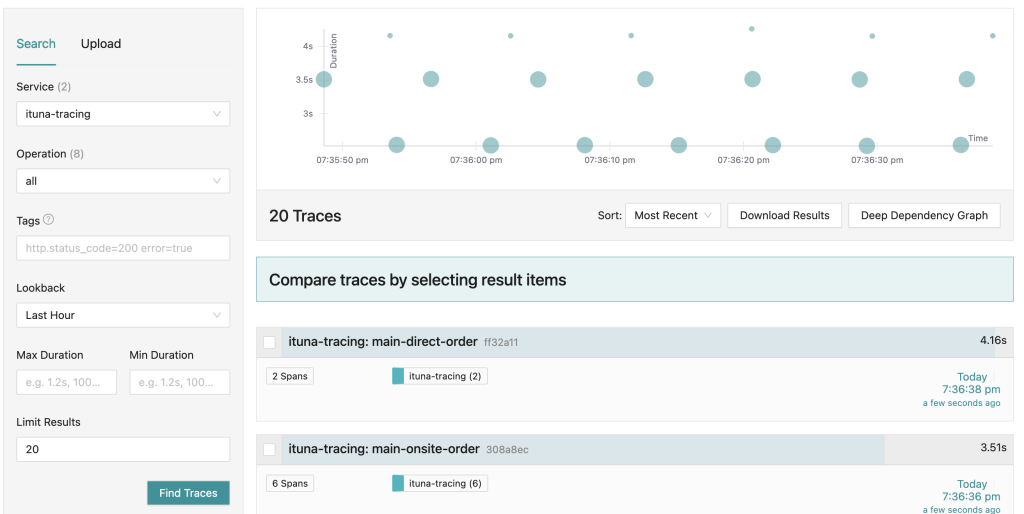
When searching for the most recent traces collected in the last few minutes, we get a view showing tracing events on the timeline:

(As the events happening during ITuna execution are driven by timers, there is no surprise seeing the pattern in the view above).
Clicking on any of the dots opens a new view, showing all individual traces that occurred in the same context:

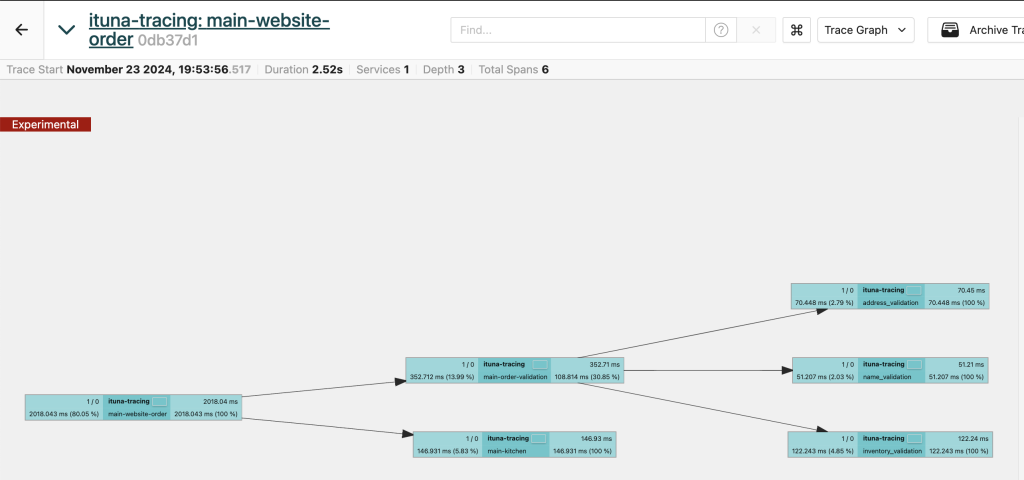
The information shown on the screenshot shows that the processing of this particular order started in the onsite ordering system and took a little over 2.5 seconds. After that, the job was processed by the order validation task, with three subtasks and their individual times reported accordingly, before finally finishing in the kitchen service task.
There is also a nice view showing the relationship between the tasks as a graph:

Summary
Monitoring and tracing of jobs inside distributed pipelines is an important task for ensuring a system’s health and efficient performance. While logging plays an important role in such monitoring, it does not always provide a sufficient way to identify potential bottlenecks in a complex application. As it has been shown on the ITuna example application, while integrating opentelemetry in the code does not require significant code changes, it yields a significant boost in visibility into the app’s performance.
Clearly, opentelemetry instrumentation helps to get useful insights about complex systems performance on individual component level, enabling service owners to identify areas of potential problems early and perform necessary optimization.